

August 2026 Economic and Investment Update:
The July AI Reset and
What the Rebound Just Told Us
The July AI Reset and
What the Rebound Just Told Us
The bottom line: July delivered the first true stress test of the AI trade in 2026 — every layer of the theme sold off at once, with more than $1 trillion of market value erased from the semiconductor complex. Then, in the final three days of the month, Lam Research, Microsoft and Amazon reported results that answered the market’s central question – is AI spending turning into revenue?
The answer was a decisive, yes.
The AI index rebounded, and the names with the clearest monetization proof rebounded hardest. Separately, SpaceX’s record IPO has given us a textbook lesson in why we don’t chase new listings. It was up 37% in two weeks, and below its issue price within five weeks – and the lockup supply and a first reality-check on multiples loom.
1. The July Meltdown: Every Layer Pulled Back at Once
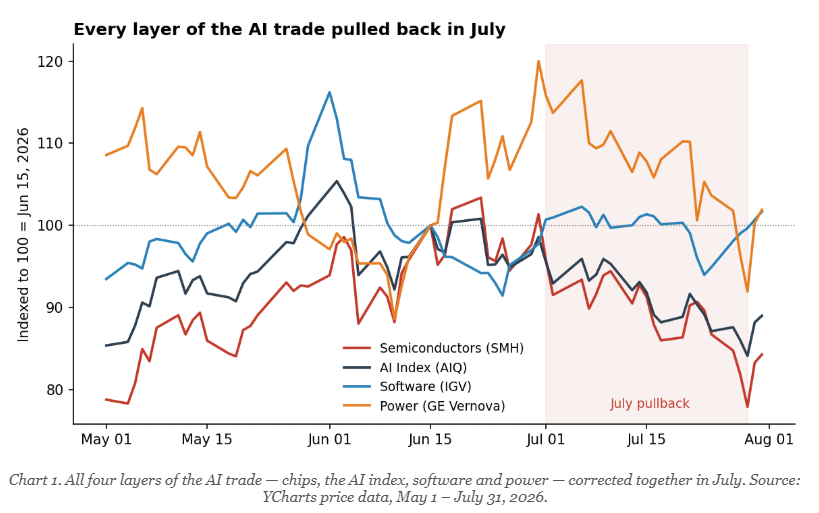
Through June, the AI trade had gone almost uninterrupted for twelve months: the Philadelphia Semiconductor Index had rallied roughly 130% over the prior year. July broke the streak, and what made it notable was its breadth. This was not one stock stumbling; it was a simultaneous repricing of every layer of the AI stack:
Chips (the compute layer). The VanEck Semiconductor ETF (SMH) fell 24.6% from its June 22 peak of $669 to $504 on July 29. Micron dropped 13% in a single session, erasing roughly $138 billion of market value; the sector as a whole shed over $1 trillion in under two months. Even Nvidia gave back about $1 trillion of value on its own.
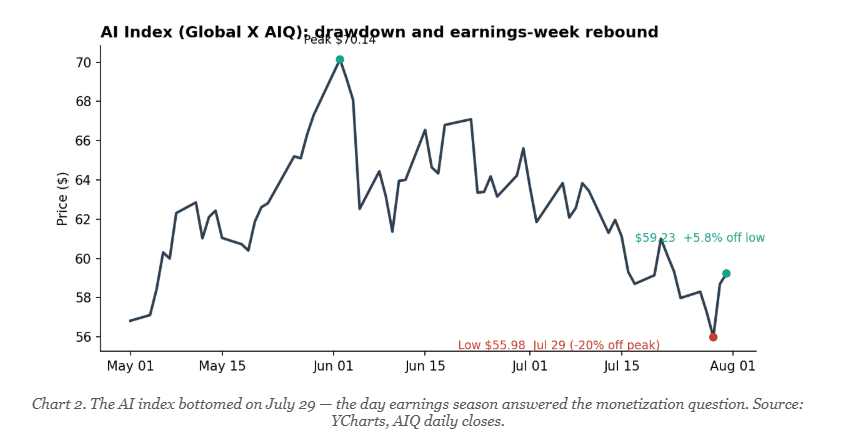
The AI index. The Global X Artificial Intelligence & Technology ETF (AIQ): our proxy for the theme, declined 20.2% from its June 2 high of $70.14 to $55.98 on July 29.
Software (the application layer). The iShares Software ETF (IGV) fell 21.3% peak-to-trough, as investors questioned whether AI would compress software economics before it expanded them.
Power and infrastructure. Even the electricity providers behind the data-center buildout corrected —GE Vernova (symbol GEV) fell 16% from peak to its July 29 low.
Why it happened
1. A crowded trade met forced selling. After a 130% one-year run, positioning was extreme and leveraged. A high-profile margin call and forced liquidation cascade – what commentators dubbed a ‘push-button liquidity’ event, turned an ordinary correction into a rout. This is the classic capitulation sequence: concentration, leverage, margin calls, forced selling.
2. Doubts about the return on capex. The four largest hyperscalers are on track to spend roughly $725 billion on capital expenditure in 2026, up 77% from $410 billion last year. When a new low-cost Chinese AI model was released mid-month, investors briefly questioned whether that spending could ever earn its keep.
Alphabet raising its 2026 capex guide to $205 billion was initially punished, not rewarded.
3. A hawkish Fed and higher yields. A more hawkish tone from the Federal Reserve under new Chair Kevin Warsh pushed the 10-year yield toward 4.5%, pressuring the long-duration growth stocks that dominate the AI theme.
4. Layer-specific scares. Reports that SK Hynix was slowing high-bandwidth memory expansion, talk of a memory ‘peak,’ Meta’s plan to sell surplus compute, and well-publicized short positions all fed the narrative.
Here is the critical point: the fundamentals never confirmed the selloff. TSMC beat and raised full-year guidance to 40%+ growth mid-decline. Micron printed revenue up 346% with record gross margins three weeks before its stock bottomed. Prices fell while demand data strengthened: that is a sentiment reset, not a broken thesis.
2. The Rebound: LRCX, Microsoft and Amazon Prove the Monetization Case
The key question hanging over the AI trade is no longer ‘will they spend?’ — it is ‘is the spending turning into revenue?’ In the last three days of July, three companies sitting at three different points of the AI value chain answered it.
Lam Research (LRCX): the equipment layer – demand is real and accelerating
Lam Research was the poster child of the July selloff, falling 41.8% from $433 on June 30 to $252 on July 29. That evening it reported record June-quarter results: revenue of $6.72 billion and EPS of $1.82, both company records and both ahead of consensus.
The guidance was the story: September-quarter revenue guided to $8.1 billion versus $7.1 billion expected; EPS of $2.15 versus $1.84, with gross margin at 52%. Management raised its 2026 industry equipment-spend outlook to the low-$150 billion range, driven explicitly by AI and data-center demand.
The stock rose about 18% the next day and ended July at $303 — up 20% from its low in two sessions. Translation: the companies buying AI chips are ordering more of the machines that make them. Demand at the deepest layer of the stack is accelerating, not peaking.
Microsoft (MSFT): the platform layer – AI revenue is now measured in tens of billions
Microsoft’s fiscal Q4, reported July 29, showed total revenue of $90.0 billion, up 18%.
Azure – it’s cloud hosting business – grew 41%, crossing $100 billion in annual revenue for the first time. Most importantly for the monetization question: Microsoft’s AI-related revenue now runs above a $37 billion annualized rate, up 123% year over year, and Microsoft 365 Copilot has passed 30 million paid seats.
Guidance called for 45% Azure growth next quarter which was above consensus. Yes, capex reached $41 billion for the quarter, up 69% but a business generating 40%+ cloud growth and a $37 billion AI run-rate is precisely what earning a return on capex looks like. The stock jumped roughly 15% on the print to $461.
Amazon (AMZN): the adoption layer – customers are committing at record scale
Amazon’s Q2, reported July 30, was the cleanest read on customer adoption. Revenue rose 20% to $200.6 billion; EPS of $1.97 beat the $1.82 estimate.
AWS grew 36.7%, its fastest in 18 quarters, and Amazon disclosed that its AI business and its custom-chip business have each passed a $25 billion annualized run rate. The single most telling number: AWS’s backlog of contracted-but-not-yet-delivered work reached $496 billion. That is nearly half a trillion dollars of customers signing multi-year commitments to consume AI-era cloud capacity.
Amazon raised 2026 capex plans to roughly $220 billion, and the market cheered rather than punished it. The stock gained about 15% to close July at $271.
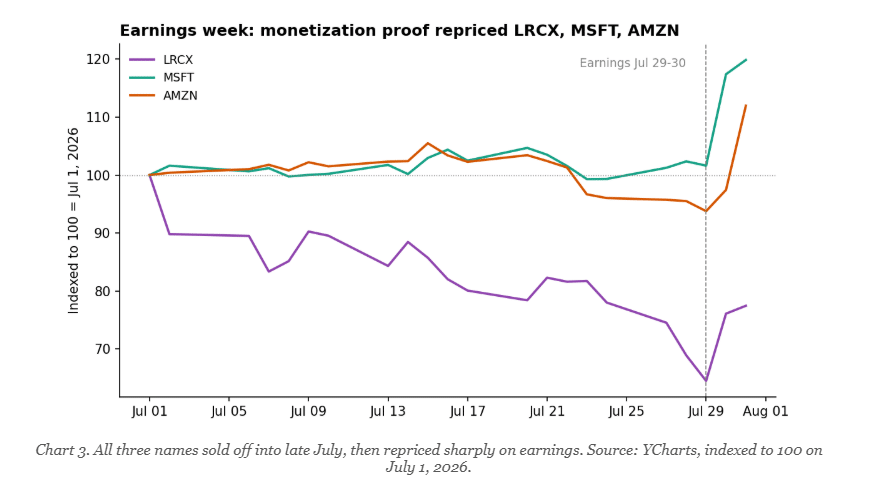
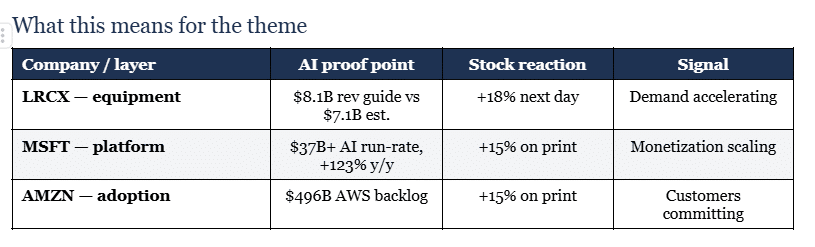
Adoption is progressing along exactly the sequence you would want – equipment orders accelerating at the bottom of the stack, platform AI revenue compounding at over 100% growth in the middle, and customers signing contracted commitments approaching half a trillion dollars at the top. The AI index bottomed the very day this evidence arrived and finished the month 5.8% off its low, with the strongest proof points rebounding 15–20%.
The July episode repriced sentiment; the earnings repriced it back where the evidence was strongest. We view the pullback as a healthy reset within an intact multi-year buildout, with the caveat that this remains a volatile, momentum-heavy theme where position sizing does the real risk management.
3. SpaceX: A Case Study in IPO Gravity
SpaceX (Nasdaq: SPCX) completed the largest IPO in history on June 12, pricing at $135 and raising roughly $75 billion before the overallotment, at a valuation around $2.3 trillion.
The first two weeks: euphoria by design
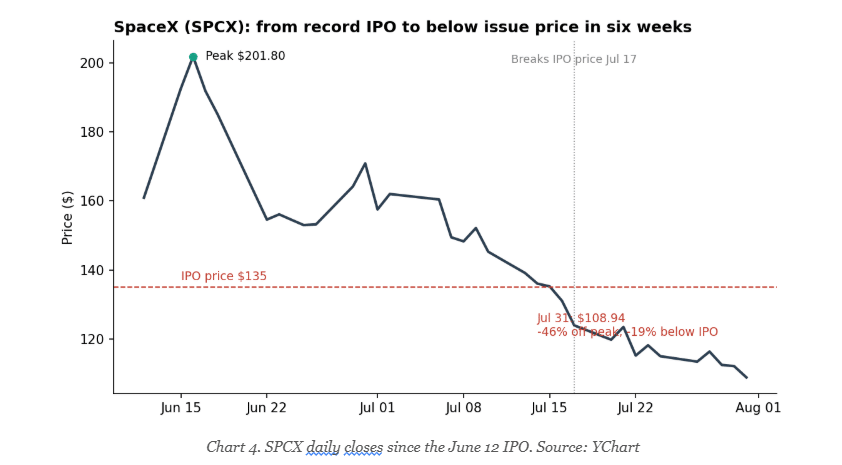
The debut was everything the headlines promised. Shares closed day one at $161, up 19%, after touching $176 intraday. They rose another 20% in the first full session and ended week one 37% above the IPO price, peaking near $202 on June 16-17.
Retail investors were the largest net buyers, putting more money into SPCX than into Nvidia, and index funds were forced buyers, with passive vehicles set to own roughly 30% of the float within two weeks.
Understand why this happens: only 4–5% of SpaceX’s shares were actually available to trade. A record wave of demand met a deliberately tiny supply of stock. Early IPO pops are frequently a float-scarcity effect, not a verdict on value.
The drawdown: supply and arithmetic reassert themselves
From the $202 peak, SPCX fell steadily below its $135 issue price by July 17, closing July at $108.94, down 46% from the peak and 19% below the IPO price in six weeks.
Earnings Update: On August 4, SpaceX delivered its first earnings report as a public company: revenue of $7.81 billion, up 92% year over year and nearly $900 million ahead of the roughly $6.9 billion consensus. Starlink-led connectivity revenue rose 66% to $4.3 billion as subscribers doubled to 12 million, adjusted EBITDA nearly tripled to $3.5 billion, and the net loss narrowed to $541 million. The stock rose 9.4% into the print, then sold off on the other number: quarterly capital expenditure of $18.4 billion, 39% above estimates, with $15.8 billion of it directed at AI infrastructure. Shares fell to $108.27 the following day. That is the multiple reality check we described, live: a beat on every revenue line, punished on spending, because public markets now mark this story against arithmetic every 90 days.
Then came the lockup.
On August 6, the first tranche – 911.5 million shares, roughly $116 billion of stock became eligible for sale, lifting the tradable float from 4.9% to 11.8% of shares outstanding. The widely feared crash did not arrive: shares rose 6.1% on the day, because six weeks of decline had already pre-priced the supply. JPMorgan noted significant pre-positioning ahead of the expiration. SPCX closed August 7 at $133.11 – up 23% in two sessions, though still just below the $135 IPO price and 34% below the June peak.
Our takeaway for you: we do not buy IPOs in the honeymoon window. If SpaceX belongs in portfolios, the disciplined entry comes after the lockup supply clears and after two or three earnings reports establish what the business actually earns.
Patience here is not caution for its own sake; it is simply buying after the sellers you can see coming have sold.
Sources
Company results are drawn from SEC filings and investor-relations releases; market commentary from sell-side and financial press coverage. Price data: YCharts.
• Microsoft FY26 Q4 press release — Microsoft Investor Relations (July 29, 2026)
• Microsoft Form 10-K FY2026 — SEC EDGAR
• Microsoft (MSFT) Q4 earnings report 2026 — CNBC
• Lam Research Q4 FY2026 results and investor deck — Investing.com / Lam Research IR
• Lam Research Investor Relations
• Amazon (AMZN) Q2 earnings report 2026 — CNBC
• Amazon Q2 2026 earnings call transcript — Investing.com
• Chip stocks shed more than $1 trillion — CNBC (July 29, 2026)
• Hyperscalers’ aggressive AI spending is rattling their stocks — CNBC (July 27, 2026)
• AI margin call and rebound outlook — Fortune (July 18, 2026)
• The AI Pullback Playbook — The AI Corner (July 17, 2026)
• SpaceX IPO day-one recap (SPCX closes at $161) — CNBC (June 12, 2026)
• SpaceX shares end first week up 37% — Yahoo Finance / Bloomberg
• SpaceX falls under IPO price as lockups loom — Axios (July 17, 2026)
• SpaceX lockup expiration schedule — StockAlarm Pro
• Morgan Stanley on SpaceX lockup expiry — Yahoo Finance
Disclaimer
Portus Wealth Advisors, LLC (“Portus”) is a registered investment adviser with the U.S. Securities and Exchange Commission (“SEC”). Registration with the SEC does not imply a certain level of skill or training and does not constitute endorsement by the SEC.
The information contained in this communication is for informational purposes only, is general in nature, and is not directed to any specific individual. It does not constitute investment advice, a recommendation, or an offer to buy or sell any security. Reading this communication does not create an advisory relationship with Portus.
The views and opinions expressed herein are those of Portus as of the date of publication and are subject to change without notice. Portus makes no representation that any opinion or projection will be realized. Information has been obtained from sources believed to be reliable; however, Portus does not warrant its accuracy, completeness, or timeliness.
Investing involves risk, including the possible loss of principal. Past performance is not indicative of future results. Different types of investments involve varying degrees of risk, and there can be no assurance that any specific strategy will be profitable or suitable for an investor’s individual circumstances. Investors should consult their own tax, legal, and financial professionals before making investment decisions.
