

November 2026
Economic
and Investment Update
Midterms 2026:
We Missed the Map, Not the Market
Economic
and Investment Update
Midterms 2026:
We Missed the Map, Not the Market
A Crash, a Bounce, and a Rally in Four Sessions
I wrote the piece below on Wednesday morning, with futures up and the vote behind us. Thursday then reminded everyone that markets read the same news twice: once for the headline and again for what the headline might mean.
On Thursday, November 5, investors dumped AI stocks on fears that a Democratic Congress would bring tougher rules for data centers. The S&P 500 fell 4.36% and the Nasdaq Composite 5.52%, the worst day for both since April 2025. The Nasdaq 100 dropped 6.4%, its worst session since March 2020, the semiconductor index lost about 12%, and U.S. options volume hit a record 112 million contracts. The Nasdaq closed nearly 12% below its October 6 record, officially in correction.
Then the buyers came back. On Friday, chips led: the semiconductor index rose about 4%, AMD added 11% and the Nasdaq finished up 1.1%. That held even as a hot October jobs report (165,000 payrolls against 65,000 expected) lifted the odds of a December rate hike to 78%. The S&P 500 still closed the week down 2.7%, its worst week in over a year.
Monday did the heavy lifting. The S&P 500 rose 2.35% to 7,549.94, its best day since April and the Nasdaq gained 2.74%. AMD jumped 13%, Applied Materials rose 11%, and Meta, Tesla and Microsoft gained between roughly 2.8% and 5.5%. Oil fell more than 4% as Iran tensions eased and Morgan Stanley and UBS both called the AI rout overdone, arguing that extreme data center regulation under a Democratic Congress is unlikely to play out.
By my math, the two sessions won back about 59% of Thursday’s S&P 500 loss and about 66% of the Nasdaq’s. The S&P 500 now sits almost exactly where it closed on November 2, up about 10.3% for the year against 10.2% then. A lot of motion to end up near the starting line.
Every Move Is a Series of Decisions, Not One
Clients sometimes picture portfolio management as one big call: right or wrong, in or out. A week like this shows why it is an aftermath of a series of decisions. Each session handed us a different question and the answer to one did not settle the next.
- Wednesday: does the outcome change the thesis? Our answer was no. Divided government still holds and the data center risk sits mostly at the state level, with the White House on the other side of it.
- Thursday: is the selloff new information or a fear we already weighed? A 12% day in semiconductors is loud, so the test is whether the fundamentals moved with it. Earnings did not change between Wednesday and Thursday. Sentiment did.
- Friday: does the jobs report change the math? For valuations, yes. Higher rate expectations raise the cost of financing data centers. That is a real pressure on AI multiples and a different one from the regulation scare.
- Monday: does a 2.35% rally mean the danger has passed? Not on its own. CNN’s Fear & Greed index only climbed from 22 to 32, still in fear territory. And Nvidia fell 4.27% on a board investigation tied to its CEO while AMD rose 13%. Same theme, a 17-point gap in one day.
None of those answers came from the one before it. Wednesday’s conviction did not tell us how to read Thursday, and Thursday’s fear did not tell us what Monday would bring.
How We Adapt When the Tape Gets Violent
Daily moves of 4% to 6% compress weeks of normal volatility into a single session. In that environment, a few adjustments matter more than usual.
- We separate the story from the earnings. Thursday sold a policy fear. The question we keep asking is whether analyst estimates for AI companies are being cut. A price drop without estimate cuts is a very different animal from one that comes with them.
- We act in steps, not all at once. When daily swings are this wide, a single entry or exit point is close to a coin flip. Adding or trimming in stages lets us respond to new information without betting a position on one session’s close.
- We diversify within the theme, not just across it. Monday’s Nvidia and AMD split is the case for owning the AI buildout through several companies and layers, from chips to equipment to power, rather than leaning on one stock.
- We watch rates as closely as politics. Friday’s jobs data and Monday’s move in the December Federal Reserve’s interest rate hike odds to roughly 84% matter as much to AI valuations as anything Congress does.
- We don’t chase the bounce. Two strong days recovered most of the loss, but the market still has to get through October CPI this morning (Tuesday) and Nvidia’s earnings (and the subsequent conference call) on November 17.
What follows is the piece as I wrote it Wednesday. The core of it, divided government, an AI policy scare that is mostly state-level, and a market that comes back to earnings, got its first real test on Thursday. Monday suggests it passed round one.
Into the Vote: a 9% Drop, a 19% Rebound, and a Calm Tape
Equities walked into Election Day in better shape than the midterm playbook says they should.
As of the November 2 close, the last one before Election Day in my data, the S&P 500 was up 10.2% for the year. Bank of America had the S&P 500 up 13% as of late September, against an average of roughly 3% for a midterm year, which put 2026 on course for its best midterm year since 2006.
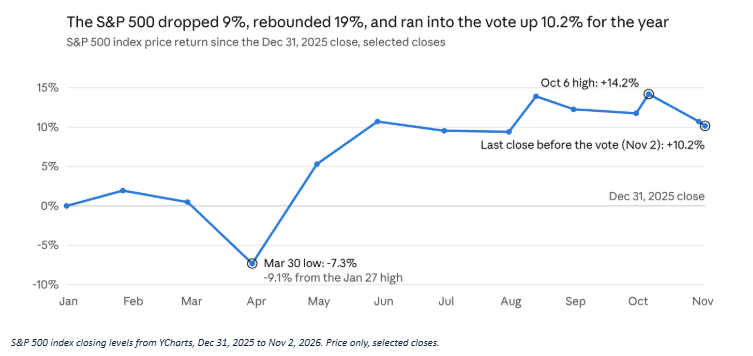
Underneath, the path was bumpier than the headline. The index topped out at 7,818.93 on October 6 and gave back 3.5% by November 2. Options traders still treated the vote as a non-event: the S&P 500 was priced for a move of about 0.9% on Wednesday, the same as a payrolls day, against about 0.7% on a normal day.
That is the standard midterm tape. Vanguard’s data back to 1957 shows weekly S&P 500 volatility averaging 14.7% in midterm years against 12.5% in other years, and it has typically been temporary. As I write this, S&P 500 futures are up about 0.9% on Wednesday.
Our Base Case Was Gridlock. We Got the Bigger Version.
Our base case going in was a split Congress, with the House and the Senate pointing in different directions. Markets like that setup because it freezes policy, and a market that Washington cannot surprise goes back to pricing earnings. The logic holds. The map did not.
The odds already leaned the other way. On November 1, a JP Morgan study through prediction markets put 66% on a Democratic sweep and 26% on a Democratic House with a Republican Senate. Voters picked the bigger wave. Seven Republican-held Senate seats have been called for Democrats (Iowa, Kansas, North Carolina, Ohio, South Carolina, Maine and Texas), with Alaska and Mississippi still out, and the House majority looks to land near 255 seats.
Here is why the miss matters less than it looks. A Democratic Congress still must get past a Republican president’s veto, and Democrats cannot reach veto-proof majorities in both chambers. That is divided government. It is gridlock with a bigger megaphone.
The calendar shows where the friction lives. Government funding runs out December 11, and a short-term extension into February or March looks most likely. The debt limit has to be raised by next fall. Democrats will lean on those deadlines to push on the Iran war, tariff rollbacks and last year’s spending cuts. Those are budget fights, not a change of regime. Trump has also signaled he is “absolutely willing” to work with Democrats.
The history backs the mechanism. Since 1950, the S&P 500 has gained 21% over a two-year term under gridlock, against 18% under single-party control.
Forward Returns When the House Flips Under a Republican President
A Motley Fool analysis of Robert Shiller’s data set since 1874 finds 14 midterms that ended in divided government under a Republican president. The S&P 500 averaged an 18% gain over the next 12 months and finished higher 93% of the time. Their definition of divided covers a Congress held entirely by the other party, so it covers the outcome we just got. Unified Republican government, the arrangement we are leaving behind, averaged -1% with 43% of cases positive.
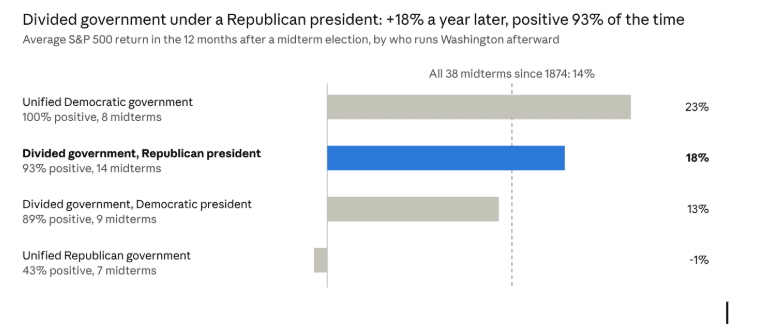
Motley Fool analysis of 38 midterm elections since 1874.
Under a Republican president, a Democratic sweep and a House-only flip lead to the same place: more gridlock, more funding fights and wider policy dispersion. Trade the consequences, not the winner.
As per a study conducted by Vanguard, since 1929, average annual returns have run 11% to 13% across every government configuration, so the balance of power has had little consistent bearing on performance. I take that as permission to stop trading the headline and go back to the earnings, where the real inflections show up.
We believe forward returns will be strong, and Wednesday’s tape agreed. J.P. Morgan flagged an everything rallies in morning futures, with every sector bid except Energy and Utilities.
AI Data Centers: Loud on the Trail, Low on the Action List
No issue got more airtime in the market conversation. J.P. Morgan called the Texas governor’s race, and what it means for data centers, the biggest topic going into the vote. Democrat Hinojosa, who favors a moratorium on new builds until guardrails are written, beat Governor Abbott. Nasdaq 100 futures fell more than 2% overnight, then climbed back into the green.
The research says relax, and I agree. Goldman Sachs finds data centers sit low on voters’ list of priorities this cycle and expects the issue to fade over the coming months, with any moratoria short-lived. AP reporting points the same way: the issue still ranks behind concerns like cost of living.
Congress is not the channel. Goldman notes federal AI and data center rules would need bipartisan Senate votes and would have to survive a veto, and notes Trump has said he will not sign any bill that limits AI expansion.
The White House sits firmly on the other side. Trump frames data centers as a national and economic security priority tied to winning the AI race against China. The administration’s AI framework urges Congress to streamline permitting and limit state authority over AI.
How Markets Have Done After the Midterms
This is one of the more reliable patterns in the market. The S&P 500 has been higher a year after every midterm election since 1950, with an average gain of about 15%. The worst one-year result came after the 1986 midterms, which ties to the 1987 crash rather than anything in Washington.
Bank of America finds that since World War II the S&P 500 has risen in every six-month and 12-month window after a midterm, averaging about 13% and 14%. The Motley Fool dataset back to 1874 has the index higher in 32 of 38 years after a midterm, averaging 14%.
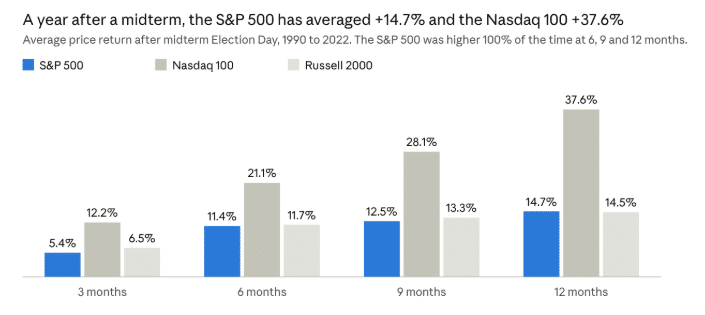
Two details matter for positioning. The first day after is quiet: since 1970 the S&P 500 has averaged +0.4% the day after a midterm and been up 10 times out of 14, so there is no race to the open. And leadership tilts toward growth.
Bottom line
We missed the map and kept the mechanism. A Democratic Congress facing a Republican president is divided government. History has paid an average 18% a year later in that setup, and the AI policy scare is mostly a short-term, state-level story with the White House on the other side of it.
The path will not be smooth. J.P. Morgan flags a Middle East re-escalation as the biggest non-AI risk, services price pressure is hot (the ISM services prices index hit a cycle high of 74.0 in September), and the 10-year yield sits near 4.9%.
So we stay constructive, and we keep our eyes on earnings, where the next real inflections will come from.
Sources
- Goldman Sachs Economics Research, “USA: Democrats Win a House and Senate Majority with Gains Well Above Expectations,” November 4, 2026
- J.P. Morgan US Market Intelligence morning briefings, November 2 and November 4, 2026
- J.P. Morgan International Market Intelligence morning briefing, November 4, 2026
- Vanguard, “Midterm elections: What history says for markets and investors,” data as of August 4, 2026
- Motley Fool, best markets in the 12 months after a midterm election since 1874
- investingLive, Bank of America on the S&P 500 and post-election gains
- PBS NewsHour (AP), Trump keeps embracing data centers, an unpopular topic in midterm races
- Roll Call, data center moratorium pitched as counter to AI impacts
- S&P 500 index closing levels from YCharts, through November 2, 2026
- Reuters via The Detroit News, “Wall St rallies after last week’s AI rout; Nvidia falls,” November 9, 2026
- Reuters via bdnews24, “Nasdaq rebounds but posts fourth straight weekly decline,” November 7, 2026
- Beinsure, US stock market: Nasdaq rebounds as Dow falls after AI selloff, November 6, 2026
- Investrade, Market Review, November 6, 2026
- The Wall Street Republic, Daily Market Recap, November 9, 2026
- StockTitan, The Stock Market Today, November 9, 2026
- Motley Fool, Stock Market Today, Nov. 9: Nvidia and the Jensen Huang investigation
For informational purposes only. Not investment advice. Past performance does not guarantee future results.
Disclaimer
Portus Wealth Advisors, LLC (“Portus”) is a registered investment adviser with the U.S. Securities and Exchange Commission (“SEC”). Registration with the SEC does not imply a certain level of skill or training and does not constitute endorsement by the SEC.
The information contained in this communication is for informational purposes only, is general in nature, and is not directed to any specific individual. It does not constitute investment advice, a recommendation, or an offer to buy or sell any security. Reading this communication does not create an advisory relationship with Portus.
The views and opinions expressed herein are those of Portus as of the date of publication and are subject to change without notice. Portus makes no representation that any opinion or projection will be realized. Information has been obtained from sources believed to be reliable; however, Portus does not warrant its accuracy, completeness, or timeliness.
Investing involves risk, including the possible loss of principal. Past performance is not indicative of future results. Different types of investments involve varying degrees of risk, and there can be no assurance that any specific strategy will be profitable or suitable for an investor’s individual circumstances. Investors should consult their own tax, legal, and financial professionals before making investment decisions.
